

Most Zillow vs Realtor.com comparisons are written from the perspective of the listing agent rather than the client or prospect. And the truth is that many Realtors hate Zillow. 😤 But what about their clients?
Using Similarweb and Ahrefs data plus actual, page-level property listing data, we compared Zillow.com vs Realtor.com for traffic, backlinks, property listings, and much more.
The results are shocking! 🤯
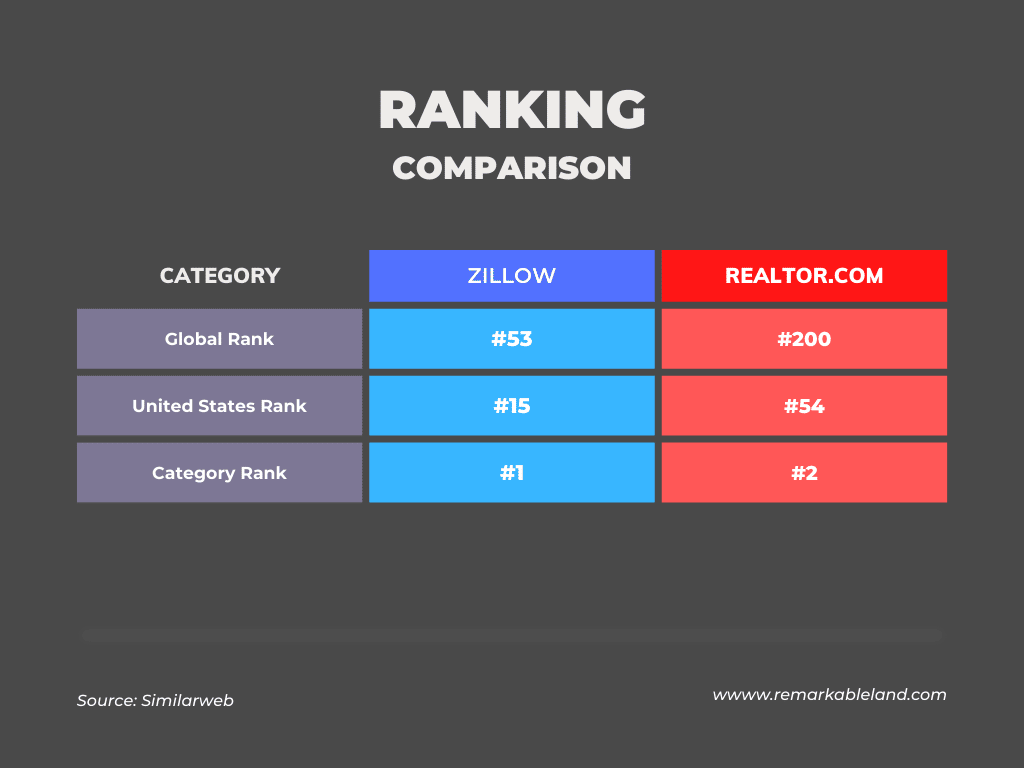
- Zillow ranks higher.
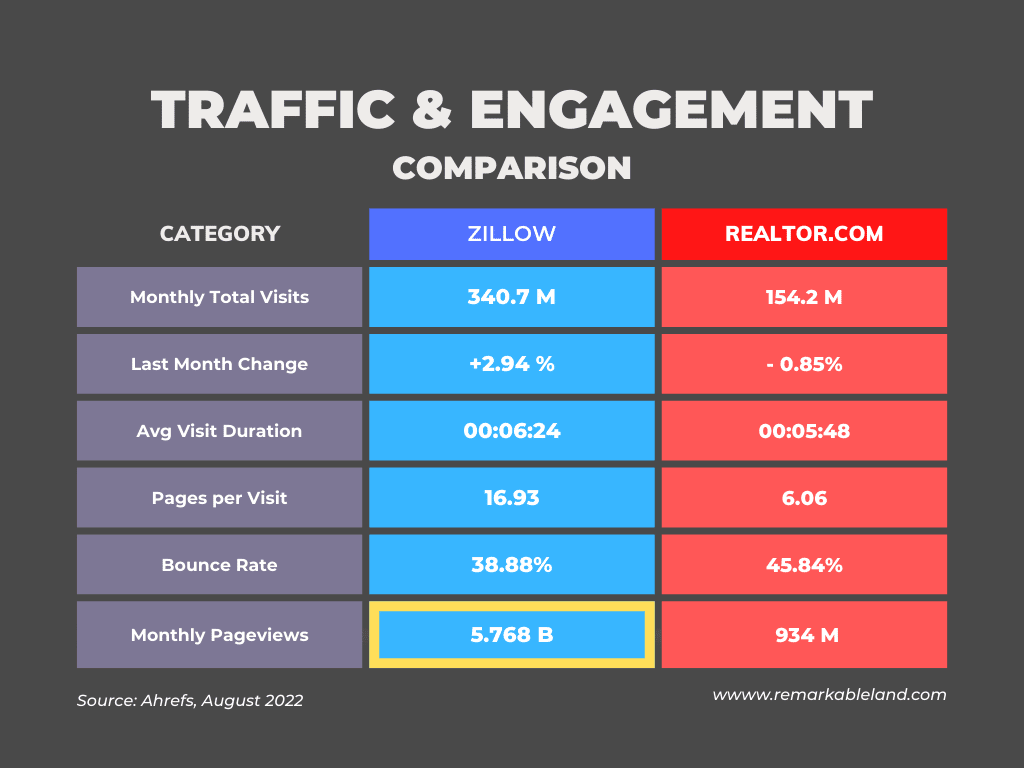
- Zillow receives two times more visits per month.
- Zillow users browse ten more listings per visit.
- Zillow receives over 500% more pageviews per month!
- But… Realtor.com has 33% more property listings!
Let's dig into the data so you won't miss a listing when looking for a property!
Table of Contents
Zillow vs Realtor: Ranking Comparison
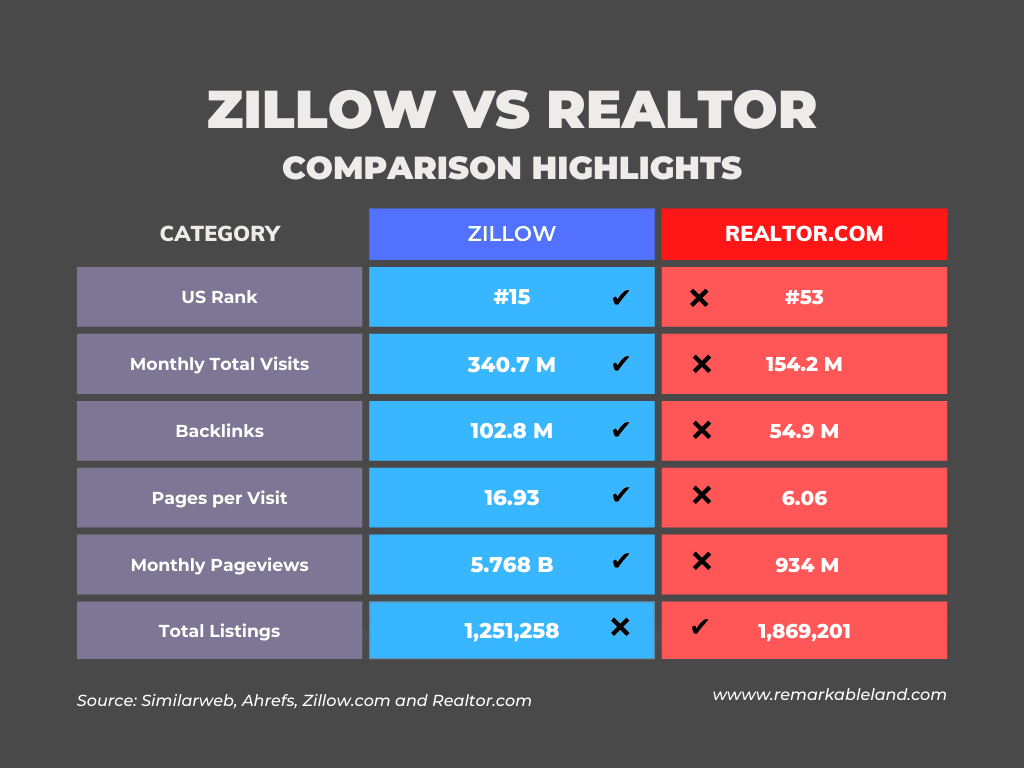
Zillow and Realtor.com rank #1 and #2 in the real estate category in the United States and rank high domestically and internationally. Both sites have strong brand recognition and battle for traffic and listing supremacy for house and land listings in the United States. Realtor.com had a running start in this race though, but Zillow still managed to lap them in short order.
Zillow vs Realtor: Traffic & Engagement
Two statistics stand out in this comparison. First, Zillow receives 121% more visits per month than Realtor.com. And with only a 10% higher average visit duration, browsers visit 180% more pages per visit. Second, combing those two statistics, Zillow received over 500% more pageviews than Realtor.com. Zillow property listings receive more pageviews than Realtor.com property listings; meaning, more people will see that your house is for sale on Zillow than on Realtor.com. Whoa!
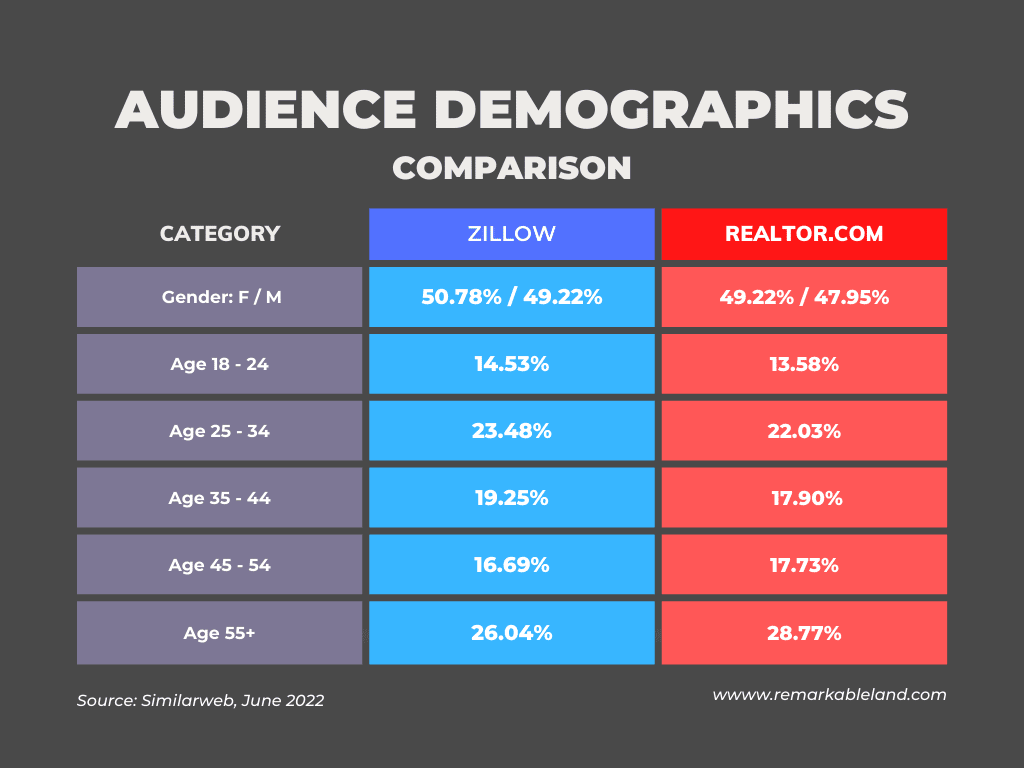
Zillow vs Realtor: Audience Demographics
Zillow and Realtor.com have nearly identical demographic profiles, and neither has a particularly meaningful edge for any age range or gender. There's no significant generational difference in usage or adoption either.
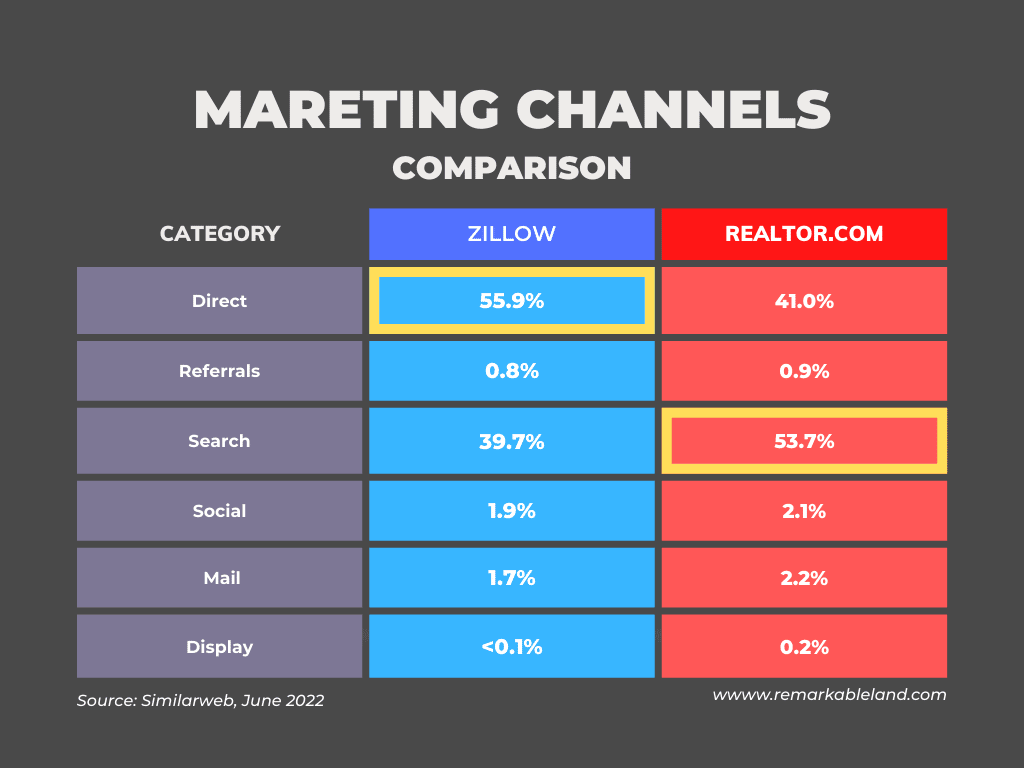
Zillow vs Realtor: Marketing Channels
Based on marketing channels, Zillow receives more direct traffic, whereas Realtor.com receives more search traffic, which will make sense when we look at listing data later in the post. This means that 56% of Zillow's traffic originates on Zillow; browsers are going to Zillow to start their real estate searches. Whereas 54% of Realtor.com's traffic is from search results.
Zillow vs Realtor: Domain Rating, Backlinks, & Traffic
Using Ahref's Site Explorer tool, Zillow and Realtor.com both rank DR 91; a domain rating (DR) is the strength of a site's backlink profile on a 100-point logarithmic scale. Ahrefs ranks Zillow's backlink profile as 513 globally compared to 661 for Realtor.com. And Zillow has almost 87% more backlinks from only 9% more referring domains.
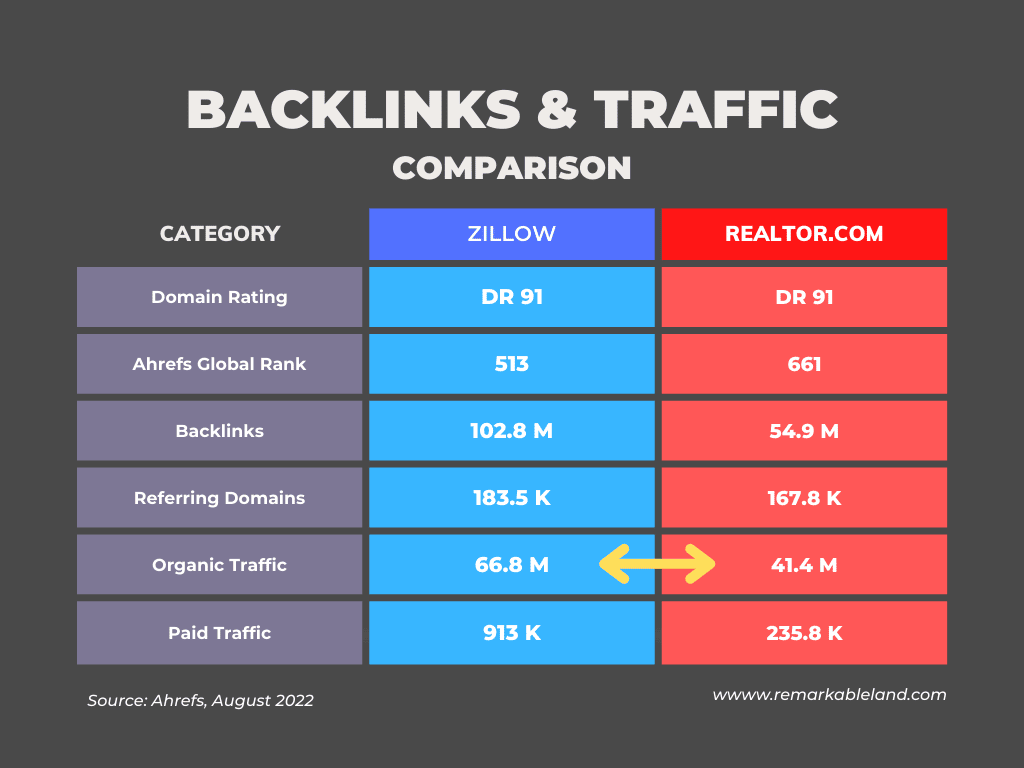
The result of that SEO-mumbo jumbo is organic traffic! ✈️ 🚆 🚙
Zillow receives 61% more organic traffic than Realtor.com and 100% to 400% more paid traffic, depending on monthly ad spend. Zillow's recent paid traffic has been as high as 8 million, whereas Realtor.com peaked at around 4 million. Zillow spends more on pay-per-click marketing.
Zillow vs Realtor: App Rankings & Ratings
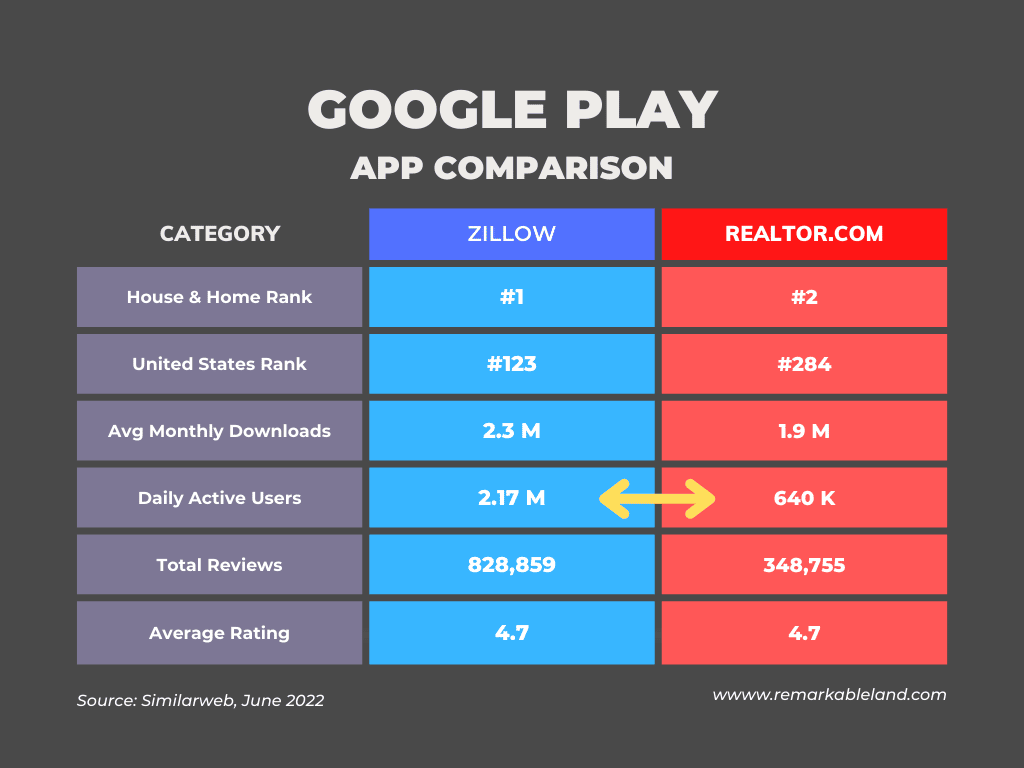
Google Play Store
Much like previous traffic statistics, Zillow's Android app outperforms and ranks higher than Realtor.com's. Zillow's Android app has 2.4 times more daily active users than Realtor.com's.
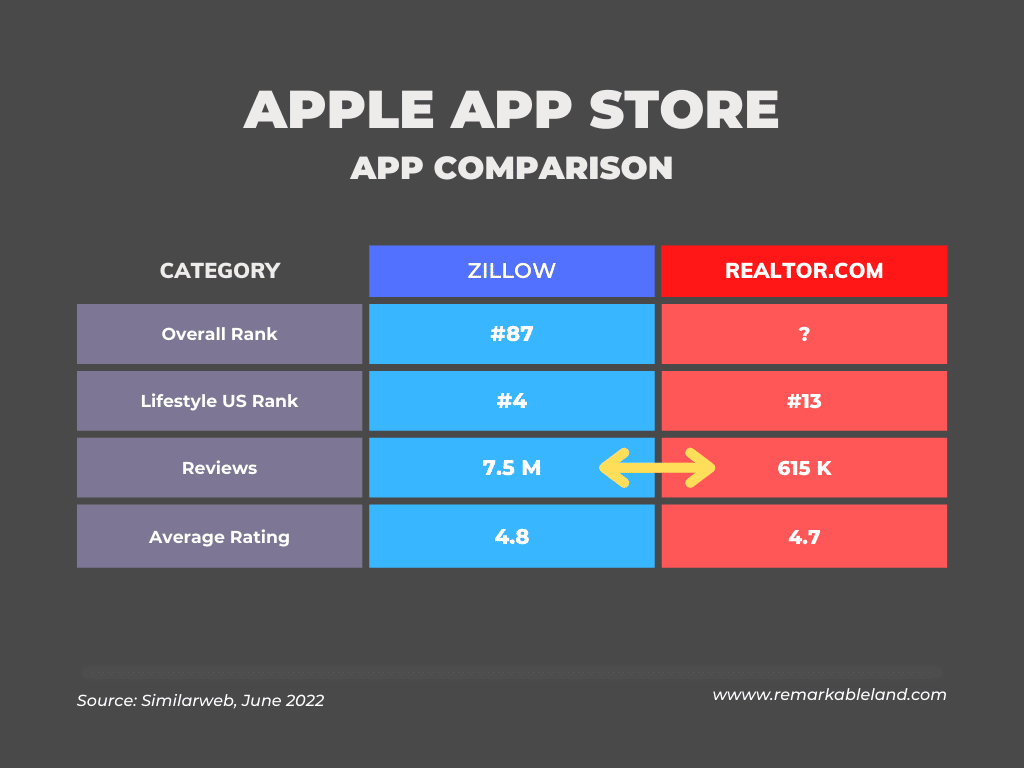
Apple App Store
On iOS, the Zillow app has almost 7.5 million reviews with a 4.8 average rating compared to Realtor.com's 615,342 reviews with a 4.7 average rating. Apple users prefer Zillow 10x more.
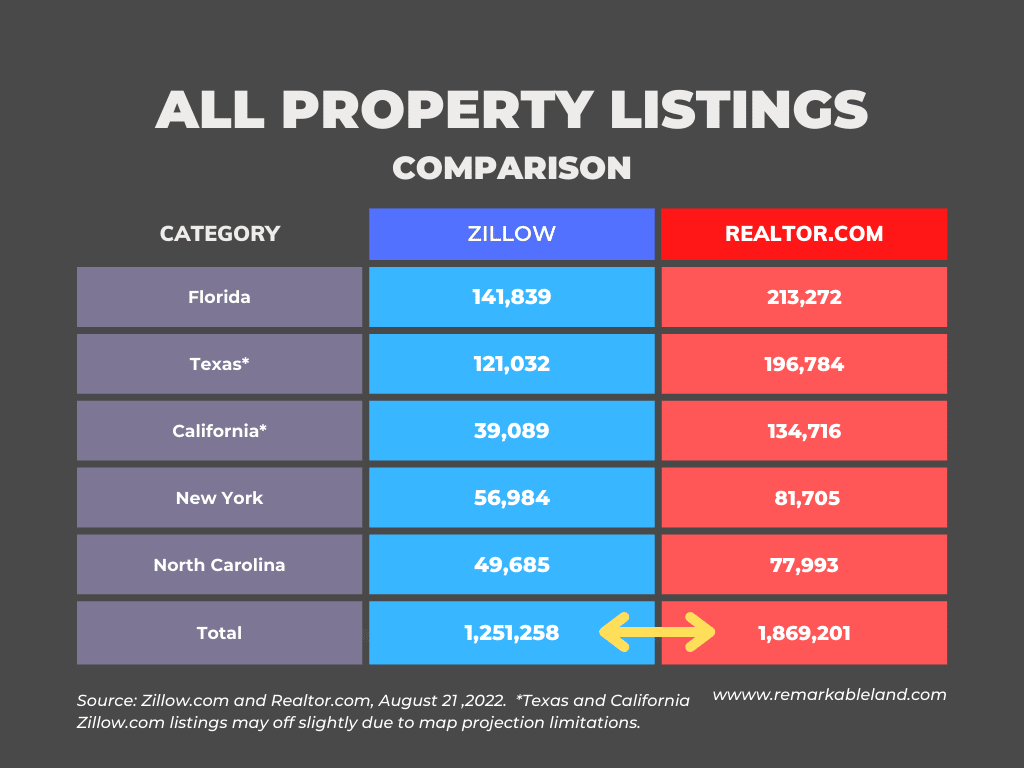
Zillow vs Realtor: All Property Listings by State
We manually searched, reviewed, and compiled all property listings and all land listing on Zillow and Realtor.com by state. Ranging from 3% to 56% with a 33% average, one in three listings on Realtor.com are not listed on Zillow.
With nearly identical keywords and high DR's, Realtor.com gets proportionately more search traffic because they simply have more listing pages. Zillow has the stronger brand (i.e. direct traffic), but Realtor.com has more pages for Google crawl and index.
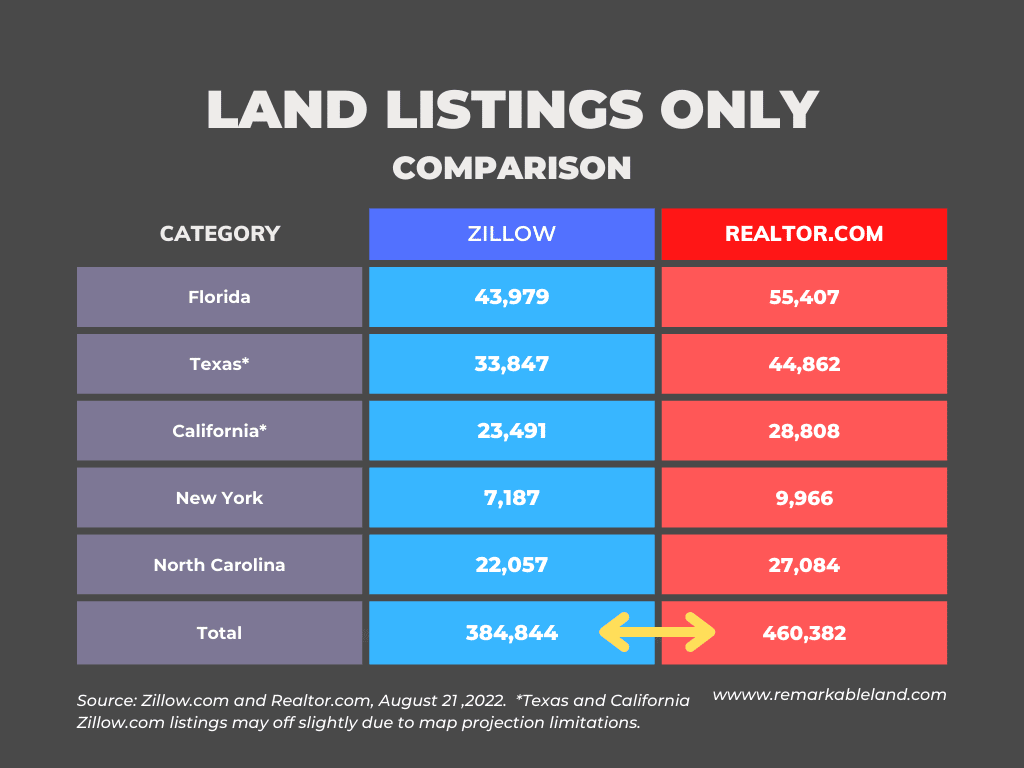
Zillow vs Realtor: Land Listings Only by State
We buy and sell land, and the genesis of this blog post grew from identifying inconsistencies and issues between Zillow and Realtor.com, while marketing our properties. Despite customer service challenges and mapping issues, Zillow was our primary listing site and traffic source until they became licensed and relegated FSBO listings to a secondary tab; when they made the switch, our Zillow traffic disappeared.
The various MLS's and Realtor.com are principally designed for home sales; so, we would have thought that land listing would suffer a worse fate. But land listing did better. Ranging from 2 to 58% with an average of 19%, only one in five Realtor.com land listings is missing on Zillow. It's still a pretty big deal if that one is yours!
Zillow vs Realtor: Final Thoughts
Real estate browsers, bots, and buyers prefer using Zillow significantly more than Realtor.com. Bots and scrapers likely inflate the traffic and pageview figures to some degree for both sites, but based on app reviews alone, consumers prefer Zillow. Other third-party websites certainly do too given the backlink profiles.
But real estate agents don't list or syndicate all of their MLS listings to Zillow; only 67% of MLS listings are discoverable on Zillow. In some situations, this may be structural and due to protective MLS's and arcane state laws, but in others, and given the overall trend, realtors simply aren't posting their listings on their “competition's” site. This does their listings and their clients a disservice.
Do clients realize this? Probably not!
Consumers don't care about the battle between the National Association of Realtors and Zillow. They don't care about the regional MLS fiefdoms. And to a large degree, they're tired of paying 6% commissions. Consumers want to sell their houses ASAP for the best price, and buyers want to find their dream home or property with the best website or app.
In reality, Zillow has joined the NAR-fold of late. They are no longer iBuying, and they are now a licensed broker. They've relegated — effectively hiding — for-sale-by-owner listings (FSBO) to a secondary tab. And ALL real estate websites are rife with data errors and inaccuracies. Zestimates can be misleading and tricky, but in reality, pricing is opaque and difficult; they're trying to innovate and solve a complex problem. Good for them!
Data Appendix: Zillow vs Realtor - All Listings by State
Manually collected on August 21, 2022, the table below includes and compares listings on Zillow and Realtor.com for all 50 US states regardless of the property type.
* Note: Zillow figures for California, Idaho, and Texas may be off slightly due to their geographic size and how Zillow projects listing figures on the map.
| State | Realtor | Zillow | Difference | % |
|---|---|---|---|---|
| Property for Sale in Alabama | 33,096 | 26,101 | 6,995 | 21% |
| Property for Sale in Alaska | 4,229 | 4,116 | 113 | 3% |
| Property for Sale in Arizona | 56,981 | 42,532 | 14,449 | 25% |
| Property for Sale in Arkansas | 24,329 | 18,245 | 6,084 | 25% |
| Property for Sale in California* | 134,716 | 93,809 | 40,907 | 30% |
| Property for Sale in Colorado | 41,372 | 28,948 | 12,424 | 30% |
| Property for Sale in Connecticut | 16,861 | 7,975 | 8,886 | 53% |
| Property for Sale in Delaware | 6,126 | 3,515 | 2,611 | 43% |
| Property for Sale in Florida | 213,272 | 141,839 | 71,433 | 33% |
| Property for Sale in Georgia | 70,691 | 45,819 | 24,872 | 35% |
| Property for Sale in Hawaii | 7,115 | 4,528 | 2,587 | 36% |
| Property for Sale in Idaho* | 20,695 | 15,341 | 5,354 | 26% |
| Property for Sale in Illinois | 61,375 | 38,987 | 22,388 | 36% |
| Property for Sale in Indiana | 27,178 | 19,334 | 7,844 | 29% |
| Property for Sale in Iowa | 18,792 | 12,459 | 6,333 | 34% |
| Property for Sale in Kansas | 12,529 | 7,212 | 5,317 | 42% |
| Property for Sale in Kentucky | 23,740 | 16,109 | 7,631 | 32% |
| Property for Sale in Louisiana | 31,229 | 21,169 | 10,060 | 32% |
| Property for Sale in Maine | 7,943 | 6,583 | 1,360 | 17% |
| Property for Sale in Maryland | 24,481 | 14,771 | 9,710 | 40% |
| Property for Sale in Massachusetts | 14,872 | 11,824 | 3,048 | 20% |
| Property for Sale in Michigan | 51,658 | 38,495 | 13,163 | 25% |
| Property for Sale in Minnesota | 32,543 | 20,152 | 12,391 | 38% |
| Property for Sale in Mississippi | 17,116 | 11,744 | 5,372 | 31% |
| Property for Sale in Missouri | 36,517 | 23,943 | 12,574 | 34% |
| Property for Sale in Montana | 10,961 | 7,631 | 3,330 | 30% |
| Property for Sale in Nebraska | 9,660 | 5,643 | 4,017 | 42% |
| Property for Sale in Nevada | 21,771 | 19,415 | 2,356 | 11% |
| Property for Sale in New Hampshire | 6,000 | 3,994 | 2,006 | 33% |
| Property for Sale in New Jersey | 40,599 | 23,737 | 16,862 | 42% |
| Property for Sale in New Mexico | 15,353 | 11,200 | 4,153 | 27% |
| Property for Sale in New York | 81,705 | 56,984 | 24,721 | 30% |
| Property for Sale in North Carolina | 77,993 | 49,685 | 28,308 | 36% |
| Property for Sale in North Dakota | 5,473 | 4,092 | 1,381 | 25% |
| Property for Sale in Ohio | 47,207 | 26,453 | 20,754 | 44% |
| Property for Sale in Oklahoma | 27,272 | 17,795 | 9,477 | 35% |
| Property for Sale in Oregon | 26,664 | 17,400 | 9,264 | 35% |
| Property for Sale in Pennsylvania | 57,821 | 37,126 | 20,695 | 36% |
| Property for Sale in Rhode Island | 4,502 | 1,982 | 2,520 | 56% |
| Property for Sale in South Carolina | 41,861 | 26,646 | 15,215 | 36% |
| Property for Sale in South Dakota | 5,804 | 4,069 | 1,735 | 30% |
| Property for Sale in Tennessee | 49,583 | 33,673 | 15,910 | 32% |
| Property for Sale in Texas* | 196,784 | 121,032 | 75,752 | 38% |
| Property for Sale in Utah | 23,796 | 16,513 | 7,283 | 31% |
| Property for Sale in Vermont | 3,340 | 2,283 | 1,057 | 32% |
| Property for Sale in Virginia | 41,404 | 27,270 | 14,134 | 34% |
| Property for Sale in Washington | 38,237 | 27,232 | 11,005 | 29% |
| Property for Sale in West Virginia | 9,839 | 7,301 | 2,538 | 26% |
| Property for Sale in Wisconsin | 30,620 | 22,542 | 8,078 | 26% |
| Property for Sale in Wyoming | 5,496 | 4,010 | 1,486 | 27% |
| TOTAL | 1,869,201 | 1,251,258 | 617,943 | 33% |
Data Appendix: Zillow vs Realtor - Land Listings Only by State
Manually collected on August 21, 2022, the table below includes and compares listings on Zillow and Realtor.com for all 50 US states for land listing only.
* Note: Zillow figures for California, Idaho, and Texas may be off slightly due to their geographic size and how Zillow projects listing figures on the map.
| State | Realtor | Zillow | Difference | % |
|---|---|---|---|---|
| Property for Sale in Alabama | 12,445 | 10,869 | 1,576 | 14% |
| Property for Sale in Alaska | 2,231 | 2,186 | 45 | 2% |
| Property for Sale in Arizona | 14,921 | 13,422 | 1,499 | 11% |
| Property for Sale in Arkansas | 11,738 | 9,224 | 2,514 | 27% |
| Property for Sale in California* | 28,808 | 23,491 | 5,317 | 23% |
| Property for Sale in Colorado | 8,845 | 7,902 | 943 | 12% |
| Property for Sale in Connecticut | 2,178 | 1,778 | 400 | 22% |
| Property for Sale in Delaware | 754 | 556 | 198 | 36% |
| Property for Sale in Florida | 55,407 | 43,979 | 11,428 | 26% |
| Property for Sale in Georgia | 19,560 | 14,465 | 5,095 | 35% |
| Property for Sale in Hawaii | 1,812 | 1340 | 472 | 35% |
| Property for Sale in Idaho* | 6,251 | 4,970 | 1,281 | 26% |
| Property for Sale in Illinois | 11,355 | 10,471 | 884 | 8% |
| Property for Sale in Indiana | 6,349 | 5,480 | 869 | 16% |
| Property for Sale in Iowa | 5,328 | 4,182 | 1,146 | 27% |
| Property for Sale in Kansas | 2,545 | 2,205 | 340 | 15% |
| Property for Sale in Kentucky | 6,731 | 6,127 | 604 | 10% |
| Property for Sale in Louisiana | 12,047 | 9,432 | 2,615 | 28% |
| Property for Sale in Maine | 2,908 | 2,701 | 207 | 8% |
| Property for Sale in Maryland | 3,330 | 2,616 | 714 | 27% |
| Property for Sale in Massachusetts | 1,992 | 1,728 | 264 | 15% |
| Property for Sale in Michigan | 15,408 | 12,832 | 2,576 | 20% |
| Property for Sale in Minnesota | 7,603 | 6,451 | 1,152 | 18% |
| Property for Sale in Mississippi | 7,571 | 5,527 | 2,044 | 37% |
| Property for Sale in Missouri | 10,154 | 8,956 | 1,198 | 13% |
| Property for Sale in Montana | 4,153 | 3,281 | 872 | 27% |
| Property for Sale in Nebraska | 2,546 | 2,128 | 418 | 20% |
| Property for Sale in Nevada | 4,496 | 4,166 | 330 | 8% |
| Property for Sale in New Hampshire | 1,572 | 1,348 | 224 | 17% |
| Property for Sale in New Jersey | 3,534 | 2,627 | 907 | 35% |
| Property for Sale in New Mexico | 7,370 | 6,312 | 1,058 | 17% |
| Property for Sale in New York | 9,966 | 7,187 | 2,779 | 39% |
| Property for Sale in North Carolina | 27,084 | 22,057 | 5,027 | 23% |
| Property for Sale in North Dakota | 2,197 | 1,828 | 369 | 20% |
| Property for Sale in Ohio | 8,057 | 6,163 | 1,894 | 31% |
| Property for Sale in Oklahoma | 8,048 | 6,058 | 1,990 | 33% |
| Property for Sale in Oregon | 5,266 | 4,351 | 915 | 21% |
| Property for Sale in Pennsylvania | 10,787 | 9,332 | 1,455 | 16% |
| Property for Sale in Rhode Island | 454 | 288 | 166 | 58% |
| Property for Sale in South Carolina | 10,677 | 8,048 | 2,629 | 33% |
| Property for Sale in South Dakota | 2,675 | 1,906 | 769 | 40% |
| Property for Sale in Tennessee | 16,966 | 14,176 | 2,790 | 20% |
| Property for Sale in Texas* | 44,862 | 33,847 | 11,015 | 33% |
| Property for Sale in Utah | 4,996 | 3,981 | 1,015 | 25% |
| Property for Sale in Vermont | 949 | 807 | 142 | 18% |
| Property for Sale in Virginia | 12,101 | 9,531 | 2,570 | 27% |
| Property for Sale in Washington | 7,877 | 6,670 | 1,207 | 18% |
| Property for Sale in West Virginia | 3,386 | 2,978 | 408 | 14% |
| Property for Sale in Wisconsin | 12,163 | 11,038 | 1,125 | 10% |
| Property for Sale in Wyoming | 2,374 | 1,846 | 528 | 29% |
| TOTAL | 460,382 | 384,844 | 87,983 | 19% |